


Introduction
Worldwide, sugarcane is produced by over 100 countries on an area of 29 million ha with an annual production of 1.84 billion tons of sugarcane and 0.26 billion tons of sugar (Food and Agricultural Organization, 2015). Brazil was the largest producer of sugar cane in the world (Santos et al., 2015).
Sugarcane is the primary source for manufacturing crystal sugar, and ethanol, bagasse, press mud and co-generation of power are the other useful by-products (Sundar et al., 2015). Commercial sugarcane production in Ethiopia was commenced by the Dutch company called Handels-Vereening Amsterdam in 1954 with sugarcane plantation of 5,000 ha at Wonji. Later in 1962, the company installed the second sugar factory at Shoa expanding the cane plantation by 2,000 ha (Abera and Tesfaye, 2001). Similarly, other sugarcane plantations were established at Metehara (>10,000 ha) in 1969 and Fincha (>8000 ha) in 1998 (Ethiopian Agricultural Research Organization, 2000). Sugar industry plays a great role in the Ethiopia socio-economy (Ambachew and Firehun, 2012) and created work opportunity both for laborers’ and professional workers of various disciple. This has a great role in reducing unemployment in the country. The country's annual sugar production is about 300,000 tons (Ambachew and Firehun, 2012) this is by far lower than the potential and the demand of the country. Previous study revealed that sugarcane production and productivity in the two sugar factories (Metehara and Fincha) showed a decreasing trend both in cane and sugar yield in Ethiopia (Ambachew and Firehun, 2012).
Several factors affected sugarcane production and productivity in Ethiopia. Diseases are among the most important biotic trait that seriously affect the productivity of the crop. A survey conducted from 2001 to 2003 noted around 17 diseases in the Ethiopian sugarcane plantations (Abera and Teklu, 2005). Sugarcane smut, caused by Sporisorium scitamineum, was identified as the priority disease in the sugarcane plantations of the country. Sugarcane smut is a cosmopolitan disease, which, at one time or another, has proved to be significantly devastating in nearly all sugarcane-growing countries across the world (Yan et al., 2016). Yield losses that ranged from 39% to 56% in plant cane and 52% to 73% in ratoon were incurred due to sugarcane smut (Braithwaite et al., 2008). Similarly, yield losses that reached up to 43% in cane and sugar yields have been reported in Ethiopia (Abera et al., 2009). Moreover, Zekarias et al. (2010) reported a variable smut incidence of 3.78%, 3.61%, and 1.05% at Wonji, Metehara and Fincha, respectively. Furthermore, Tegene et al. (2021) have also identified smut as the most important constraint in sugarcane production and recorded smut intensity reaching up to 27% in some of the newly established sugar estates in Ethiopia.
Sugarcane smut epidemic is a multicomponent system resulting from the dynamic interactions between the pathogen, host and the physical environment, often influenced by man's activities (Magarey et al., 2004). Climate has a significant effect on the disease with the most severe smut occurring in hot, dry, irrigated farming systems while spread and escalation is slower under high rainfall conditions, resulting in lower disease pressures (Magarey et al., 2011). Designing sustainable smut management techniques thus requires measuring the impacts of sugarcane smut on sugarcane yield components as a pre-request (Viswanathan and Rao, 2011). And, the authors also underlined the need to quantify a relationship between smut intensity and, weather conditions, crop types, and cultivars. Concomitantly, the occurrence of sugarcane smut not only depends on climatic factors but also strongly influenced by agronomic practices like varietal selection and ratooning (Magarey et al., 2004). In recent years, monitoring and collection of weather variables are increasingly important in the sugar industry as well as in many other cropping situations (Magarey et al., 2002).
Climate change can directly a ff ect crops through rising temperature and changing rainfall patterns, or indirectly affect crops through soil, nutrient, and increasing pests’ interference (Cammarano et al., 2019). Variation in weather variables have caused more disease pathogen and overwintering pest and also increased the input cost to control them (Cammarano et al., 2019). Researchers and sugar industry utilize data on weather conditions, pathogens, and hosts to avoid expenditures due to spray in the absence of disease and losses resulting from unmanaged disease (Magarey et al., 2004). Besides, this information help researchers to formulate technologies to manage the disease based on the weather conditions that disfavor disease development. Sugar industries also use to schedule management practices based on weather forecast which may favor or disfavor the disease. Of course, Tegene et al. (2021) demonstrated a significant association between smut intensity and varieties, crop cycle, soil type, growth stage, irrigation system, fertilizer utilization and weed intensity. However, the study failed to consider the association between smut intensity and meteorological variables. Moreover, smut intensity variation among different months of the year, varieties, and crop cycles with in a given location as affected with weather variables was not addressed. Knowledge of this association helped the sugar industry to decide on the varieties to be planted or ratooned, and the disease management practices required in planting or ratooning specific variety. Furthermore, the effect of the disease on the above-ground growth of sugarcane was not properly explained in the previous study. In this regard, there is a need to fill the gaps.
Despite the significance and observable effects of smut on the plant, there is a dearth of knowledge regarding the level of reduction in above-ground growth of sugarcane, such as plant height, thickness, leaf area, number of leaves, and number of tillers due to smut infection. Kumar et al. (1989) reported the sever effect of sugarcane smut on plant height, cane girth, number of tillers, number of leaves and leaf area; though not quantified. Knowledge on the climatic requirements for infection and disease development is also not well characterized in the sugar plantations of the country. On the other hand, it is also pertinent to investigate the variation in smut intensity among different varieties across successive crop types to design sustainable smut management strategies. The study hypothesized that timely updates on disease impact on sugarcane growth, smut intensity variation across varieties, crop types, and weather variables are crucial for developing eco-friendly management options. Therefore, the objectives of the study were to 1) determine the effect of smut on the above-ground growth of sugarcane and 2) quantify the association of smut with weather variables, varieties, and crop types in the sugar plantations of Ethiopia.
Materials and Methods
Description of study sites.
The study on the effect of sugarcane smut on the above-ground growth, and assessment of sugarcane smut in relation to meteorological variables, varieties, and crop types were conducted at Fincha and Metehara sugar plantations in Ethiopia (Fig. 1). These sugarcane plantations were intentionally selected, as they represented the two altitude extremes, less than 1,000 and greater than 1,000 meter above sea level (m.a.s.l) of all Ethiopian sugarcane plantations. Hence, Kesem, Tendaho, and Kuraz sugarcane plantations are categorized in the first category (<1000 m.a.s.l) and represented by Metehara; while, Beles, Arjo, and Wonji sugarcane plantations are categorized in the second category (>1,000 m.a.s.l.) and represented by Fincha. Moreover, the two sugarcane plantations are old in their age of establishment and have standard agronomic practices that is accomplished on all fields invariably. Fincha Sugarcane plantation is located between 9°30’ and 10°00’N latitude and between 37°15’ to 37°30’E longitude (Fig. 1) at an altitudinal range of about 1,350 to 1,650 m.a.s.l. The average annual total rainfall of the area is about 1,298.50 mm, and the monthly average minimum and maximum temperatures are 14.68°C and 31.59°C, respectively (Fig. 2). The area is characterized by monthly average minimum and maximum relative humidity of about 41.23% and 84.01% in that order (Fig. 2). Fincha Valley has a bimodal rainfall distribution with alternate wet and dry seasons, with the major rainy season falling between May and October, while the remaining months of the year remain hot and dry. As a result, irrigation is not required between mid-June and September, but a dragline sprinkler irrigation system is used during the dry season. Metehara sugar estate is geographically located at a latitude of 8°54’N and longitude of 31°01’E with an altitude of 950 m.a.s.l (Fig. 1). This estate receives a mean annual minimum and maximum temperature of 17.36°C and 32.97°C, respectively. The area also receives an annual total rainfall of 532.9 mm, and mean annual minimum and maximum relative humidity of 27.57% and 77.41% in that order of presentation (Fig. 2).
Fig. 1.
Geographical locations and map of Fincha and Metehara sugarcane plantations assessed for sugarcane smut in Ethiopia (Tegene et al., 2021).


Assessment of sugarcane above-ground growth components.
An assessment of reduction in the above-ground growth of sugarcane crop due to smut was carried out in Fincha and Metehara sugarcane plantation on September and July, 2021 respectively. These two plantations were known to manage sugarcane fields based on standard operation invariably among fields. The number of sample stools taken for above-ground growth assessment was based on uniformity of the population from which the samples were taken (Binns et al., 2000). Sugarcane plants (both healthy and smut-affected) with 6 months of age managed according standard operation in the two sugar estates were observed to be nearly uniform with in the same field. Data on above-ground growth of sugarcane crops were assessed from randomly selected commercial fields managed following standard operation. Farm records from plantation personnel were utilized to know their age and other relevant information about the selected farms. Moreover, the standard procedures were followed to measure the above-ground growth parameters (Meyer et al. 2011; Moore and Botha, 2014). Six fields planted with the NCo 334 variety, affected by sugarcane smut; which were 6 months old, irrespective of crop cycle. Here, for both plant cane and ratoon crop types, sugarcane smut start to prevail its symptom at 2 to 2 and half months after planting in plant cane and after harvesting in ratoon crop. This implied that there is a non-significant variation among affected stools as well as healthy plants of the same field within the same age in their growth. Besides, NCo 334 was intentionally selected as it had wide area coverage, because of wider adaptability or elasticity. From each field, a total of 20 smut-affected sugarcane stools were randomly selected. Then, the number of tillers, plant height, stalk thickness, number of leaves per plant, leaf length, and width were recorded. Data on plant height, stalk thickness, number of leaves per plant, leaf length and width were taken from three tillers (minimum variation among tillers in parameters considered) under each stool and about 60 measures were taken for each of the above parameters in each field. Height of a stalk was measured from ground level to the top visible dewlap for healthy plants, and up to where whips emerge for smut-affected plants, using meter tap. Mean leaf width was taken from the average of the measurement of the width of the leaf at the top, in the middle, and at the bottom of each leaf. Mean stalk thickness was determined through measuring the lower, middle, and upper third portions of a stalk using Caliper, and averaged. Similarly, number of tillers, plant height, stalk thickness, number of leaves per plant, leaf length and leaf width for health plants in the same field were measured by taking twenty healthy stools randomly per field. The same procedures were followed to determine the values of each parameter as in smut-affected plants.
Disease monitoring across months of the year, the varieties, and crop types.
Data on the number of smut-affected stools rogued and the smut whips emerged were collected for the last 6 years (from 2015 to 2021) at Fincha and Metehara sugarcane plantations. Smut disease assessment was made based on the number of smut-affected stools and smut whips rogued by the plantation managers to manage the disease through rogueing from Fincha and Metehara for 6 years (from 2015 to 2021). The number of sample farms was determined based on Gill et al. (2010) which recommend to take 10% to 30% of the population to get representative result describing the population. As a result, a total of 31 fields with 501.13 ha area covered with B52 298, D42/58 and NCo 334 varieties were considered at Fincha. On the other hand, 48 fields with 308.5 ha area covered with B52 298, Mex 54/245 and NCo 334 varieties were assessed at Metehara sugarcane plantation. The sampled area represented 29.63% of the area covered by the three varieties at Fincha, and 14.64% of the total area covered by the three varieties at Metehara respectively. These varieties revealed resistant (B52 298), moderately resistant (D42/58, Mex 54/245) and susceptible (NCo 334) reaction to smut (Firehun et al., 2009). D42/58 variety was found only at Fincha, while Mex 54/245 was found only at Metehara. The study also intended to see their variation in the respective location across the 12 months and across successive crop types. It was known that smut monitoring and rogueing of the whole fields were done 4 to 5 times starting 2 months after planting for plant cane and after harvesting for ratoon respectively and were done monthly by trained laborers at the sugar estate (Firehun et al., 2009). Hence, these data on the number of uprooted stools and whips were collected throughout the 12 months for 6 years. Thus, the number smutted stools rogued and the number of whips emerged during inspection along with the area of inspected fields were collected for 12 months in the past 6 consecutive years (from 2015 to 2021) for the varieties widely grown in the two sugarcane plantations. Moreover, data on smut-affected stools and whips of the varieties across successive crop types were collected from the two sugarcane plantations. Rogueing data were summarized for each variety across five crop types (plant cane, 1st ratoon, 2nd ratoon up to 5th ratoon) and summarized as mean number of rogued stools being smutted and number of whips per hectare.
Weather data.
Meteorological data utilized for correlation and regression analysis was mean of 10 years (from 2011 to 2021) for each of the 12 months (Fig. 2). The weather data, such as mean monthly minimum and maximum temperatures (°C), mean monthly minimum and maximum relative humidity (%), and total monthly rainfall (mm), for the two locations across the 12 months of 10 years (from 2011 to 2021) were taken from the Meteorological Stations of Fincha and Metehara sugarcane plantations. The values are an average of 10 years for each month (Fig. 2). Following this, the data summarized the mean monthly minimum and maximum temperatures, minimum and maximum relative humidity, and total monthly rainfall.
Data analyses.
Data on the mean number of tillers per stool, plant height, stalk thickness, number of leaves per plant, and leaf area index of both smut-affected and healthy sugarcane plants were summarized using descriptive statistics using Minitab (2014). Leaf area index was determined using the formula suggested by Pessarakli (2001): leaf area index = leaf length × leaf width × 0.747. Accordingly, the reduction in number of tillers, stalk height, stalk thickness, number of leaves, and leaf area index due to smut were calculated based on the average data summarized for the healthy and smut-affected plants of the six fields of the twenty stools from each field following a scientific procedure by Magarey et al. (2011). Thus, percentage reductions in number of tillers, plant height, stalk thickness, number of leaves per plant, and leaf area index were calculated by relating the above-ground growth of the healthy plants with the diseased plants using the formula: percent reduction = (x-y) / x × 100. Where, x is either number of tillers/plant or stalks heights or stalks thickness or numbers of leaves per plant or leaf area index in the healthy plant and y is number of tillers/stools or stalks height or stalks thickness or numbers of leaves per plant or leaf area in the smut-affected plant.
The mean number of smut-affected stools and whips emerged for 12 months in 6-year periods, irrespective of the varieties and the crop types, were summed up and summarized per ha basis. The average number of rogued stools and whips per ha over each month was calculated. Correlation and multiple linear regression analysis of the number of smut-affected plants, and whips emerged with mean monthly minimum and maximum temperature (°C), mean monthly minimum and maximum relative humidity (%), and mean monthly total rainfall (mm) for the two locations were carried out using SAS version 9.0 (SAS Institute Inc., Cary, NC, USA; Statistical Analysis System, 2014). This was done to identify, and quantify the type, and level associations between the number of smut-affected stools, and whips with weather variables. The number of smut-affected stools, and whips that emerged were considered response variables, and weather parameters were considered predictor variables. A modified statistical model by Nzioki et al. (2010) and Paswan et al. (2018) was used to assess the impact of weather variables on the mean number of smut-affected stools and whips. The model is described as y = a + b1 x1 + b2 x2 + b3 x3 + b4 x4 + b5 x5. Where, y = response variable; a = pure constant; b1 = regression coefficient for mean monthly minimum temperature (x1); b2 = regression coefficient for mean monthly maximum temperature (x2); b3 = regression coefficient for mean monthly minimum relative humidity (x3), b4 = regression coefficient for mean monthly maximum relative humidity (x4); and b5 = regression coefficient for mean monthly total rainfall (x5). Furthermore, the variation in the mean number of rogued stools and whips that emerged for the three varieties across the successive crop types were summarized graphically (Minitab, 2014) to show the trends across successive crop types for each variety.
Results and Discussion
Effect of smut on sugarcane growth.
The result demonstrated that the mean numbers of tillers per stool for smut-affected stool and for health stool were 17.03 and 24.63 at Fincha and 21.33 and 27.84 at Metehara, respectively (Table 1). Comparatively, sugarcane smut resulted in a higher reduction in the numbers of tillers per stool at Fincha (30.65%) than at Metehara (23.55%) (Table 1). On the other hand, mean stalk heights of 0.88 m for smut-affected plants and 1.23 m for healthy plants were recorded at Fincha, while mean stalk height of 0.86 m for smut-affected plants and 1.06 m healthy plants were recorded at Metehara. Similarly, a higher reduction in the stalk height of the plant (27.53%) was recorded at Fincha than at Metehara (18.39%) due to damages associated with smut infection. Contrary to the number of tillers per stool, the stalk heights of both healthy and smut-affected plants were lower at Metehara than at Fincha, which could be partly attributed to the competition among plants that would have effects on the above-ground growth and the height of the plants (Table 1).
Table 1.
Mean values of sugarcane plant morphological parameters of smut-affected stools and healthy stools of NCo 334 variety recorded at 6 months of age at Fincha and Metehara Sugar Estates, Ethiopia, during the 2020/21 cropping year
Moreover, sugarcane smut also has an unavoidable effect on stalk thickness. In this regard, smut-affected and healthy plants at Fincha attained mean stalk thicknesses of 30.20 and 68.24 mm, implying a reduction in stalk thickness of 55.73%, which was very high in terms of declining cane yield. On the other hand, higher stalk thicknesses of smut-affected (37.74 mm) and healthy (83.04 mm) plants were measured at Metehara than at Fincha. However, a closely similar trend was observed in relation to a reduction (54.66%) in stalk thickness of the plants at Metehara, with a reduction recorded at Fincha (Table 1). Furthermore, a variation in numbers of leaves per plant and leaf area index of smut-affected and healthy plants was noticed between the two locations. For instance, high mean numbers of leaves per plant of smut-affected (7.75) and healthy (12.06) plants were recorded at Fincha, while low mean numbers of leaves of smut-affected and healthy plants of 6.27 and 8.21 were registered at Metehara, respectively. Such disparity also caused a lower percent reduction of 23.40% at Metehara than at Fincha (35.70%) in the number of leaves per plant. Similarly, the mean leaf area index of the smut-affected plants and healthy plants was observed to be 0.01 and 0.02 m2 in that order of presentation at both Fincha and Metehara. In this perspective, a higher reduction in leaf area index of 73.42% was recorded at Metehara than at Fincha, which noted about a 68.95% reduction in leaf area index (Table 1).
This study demonstrated that sugarcane smut significantly reduced the numbers of tillers per stool, stalk height, stalk thickness, number of leaves, and leaf area index. The influence of smut pathogens on the normal physiological and biochemical processes of the crop could be cited as the reason for such remarkable reductions in the studied morphological parameters. Above-ground growth traits are reported to be interrelated, and hence, factors that affect one of the parameters may also affect the other trait in a different way. Kingston and Rixon (2007) also reported that most diseases interfere either with the photosynthetic capacity or metabolism of the crop, which in turn results in a reduction in morphological growth. Similarly, Wada and Anaso (2016) observed a related quantitative reduction in plant morphological characters due to the smut pathogen.
Moreover, the pathogen could release exudates that affect the physiological activities of the plant and cause a reduction in the growth and development of the plant. A plant's response to the biochemical activities of the pathogen during infection could also play a meaningful role in averting or promoting disease development. In this regard, de Armas et al. (2007) and Santiago et al. (2009) found changes in the physiological process of the plant as a result of infection by smut pathogen, which could result in resistance or susceptibility of sugarcane varieties. In this connection, a reduction in leaf area index due to smut significantly reduces the size or area of the green leaf canopy, which absolutely affects the photosynthetic activity of the crop. Corroboratively, Vu et al. (2006) indicated that canopy growth is critical to whole crop photosynthesis and growth, and an increase in leaf area production would have a direct effect on the growth potential and yield of sugarcane.
Association of smut disease with weather variables.
The study showed that sugarcane smut epidemic was highly affected by variations in weather variables, especially during the primary infection periods, which lasted from 2 to 6 months after planting. As a result, number of smut-affected stools and whips across the 12 months varied at Fincha (Table 2). The maximum numbers of smut-affected stools (237) and whips (94.67) per ha were recorded during the months of March, with the temperature range between 16.20°C and 35°C and a relative humidity of between 27.30% and 66.90% coupled with a rainfall of 29.90 mm at Fincha. Conversely, minimum numbers of stools (2.54) and whips (1.08) per ha were recorded during the month of December, when the minimum and maximum temperatures were 11.50°C and 34.17°C, respectively, and a relative humidity of 30.90% (minimum) and 82.90% (maximum) with a rainfall of 6.20 mm. Moreover, the numbers of smut-affected stools and whips appeared to increase from the month of December to March, remained at a high peak for the next 4 months (April to July), and declined afterward. In the first 4 months (December to March), the number of smut-affected stools and whips showed a rapid rate of increase, while a stable disease dynamic followed by a drastic decrease in rate of development was observed after the 4 months.
Table 2.
Means for the number of smut-affected stools and whips that emerged over a 6-year period (2015 to 2021) (response variables) and the meteorological factors over a ten-year period (2011 to 2021) (explanatory variables) at Fincha sugar plantation in Ethiopia
At Metehara, the numbers of smut-affected stools and whips that emerged across the 12 months indicated that the disease occurred on the crop at different rates of development (Table 3). The highest numbers of smut-affected stools (572.00) and whips (283.00) per ha were recorded during the month of July, when the mean monthly temperature ranged between 20.25°C and 32.93°C with a relative humidity that ranged between 29.34% and 76.06% coupled with a rainfall of 123.93 mm. On the contrary, the minimum numbers of smut-affected stools (69.98) and whips (34.34) per ha were recorded during the month of December at minimum and maximum temperatures of 12.82°C and 30.24°C, and minimum and maximum relative humidity of 28.90% and 82.30%, respectively, with a rainfall of 7.05 mm. The number of smut-affected stools and whips appeared to increase from December to July, reaching the highest number at July, and started to decrease afterward until it reached the smallest numbers for each trait at the month of December.
Table 3.
Means for the number of smut-affected stools and whips that emerged over a 6-year period (2015 to 2021) (response variables) and the meteorological factors over a ten-year period (2011 to 2021) (explanatory variables) at Metehara sugarcane plantation in Ethiopia
The present finding agrees with Abera et al. (2009) and Zekarias et al. (2010), who reported the variation of smut intensity across the 12 months of the year due to the variation in weather variables and sugarcane varieties grown at both Fincha and Metehara. This study discovered a temperature range of 19.21ºC to 36ºC, relative humidity of 24.65% to 76.06%, and rainfall of 0 to 123 mm as the optimum conditions for smut disease development based on the number of smut-affected stools and whips. This could also be associated with the specific weather requirements for smut teliospore germination, infection, and disease development. Related to these findings, Sundravadana et al. (2011), Marchelo-d'Ragga and Ahmed (2015) and Ong'ala et al. (2015) also identified a similar range of temperature, relative humidity, and rainfall as optimal for the development of sugarcane smut. In this regard, Bhuiyan et al. (2009) also revealed that the optimum temperature for smut disease development is in the range of 20°C to 35°C. A temperature below 20ºC or above 35ºC has been reported to slow down or completely interrupt spore germination.
In addition, the study indicated that there was success-ful disease development during hot-dry weather conditions, and frequency of whip development with plants was enhanced under such stress conditions though high rainfall intensity is used to reduce disease severity. Similarly, Mehira and Sahu (2015) reported that sugarcane smut disease development has been rapid at a temperature above 34.8ºC and slowed down at 11.5ºC to 22.2°C temperature range. And, high temperatures, which range from 30ºC to 35°C and moderate rains are reported to favor infection and development of sugarcane smut (Shailbala et al., 2017; Sundravadana et al., 2011; Zhou, 2022). The findings could imply that weather variables could be utilized to form the basis for the development of disease prediction model(s) as the variables can influence the pathogen, host, and their interactions.
The correlation analysis revealed that significant (P<0.05) relationships between weather variables such as mean monthly minimum and maximum temperatures and mean monthly maximum relative humidity, and the mean numbers of smut-affected stools and whips that emerged (Table 4, Fig. 3). On the other hand, the mean monthly total rainfall demonstrated a non-significant association with both the number of smut-affected stools and whips. In addition, the mean monthly minimum relative humidity had a non-significant effect on the mean number of smut-affected stools. Generally, the numbers of smut-affected stools and whips were positively associated with temperature, implying that there was an increase in the numbers of smut-affected stools and whips with an increase in temperature regimes. In contrast, the number of smut-affected stools and whips were negatively associated with relative humidity, where the number of smut-affected stools and whips was found to decrease with an increase in relative humidity.
Table 4.
Correlation coefficients for weather variables and numbers of smut-affected stools and whips at Fincha and Metehara sugarcane plantations, Ethiopia, during 2015 to 2021 cropping years
Fig. 3.
Associations of mean numbers of rogued stools and whips emerged with mean monthly minimum and maximum temperatures and relative humidity during 2015 to 2021 cropping years at Fincha and Metehara sugar estates in Ethiopia.
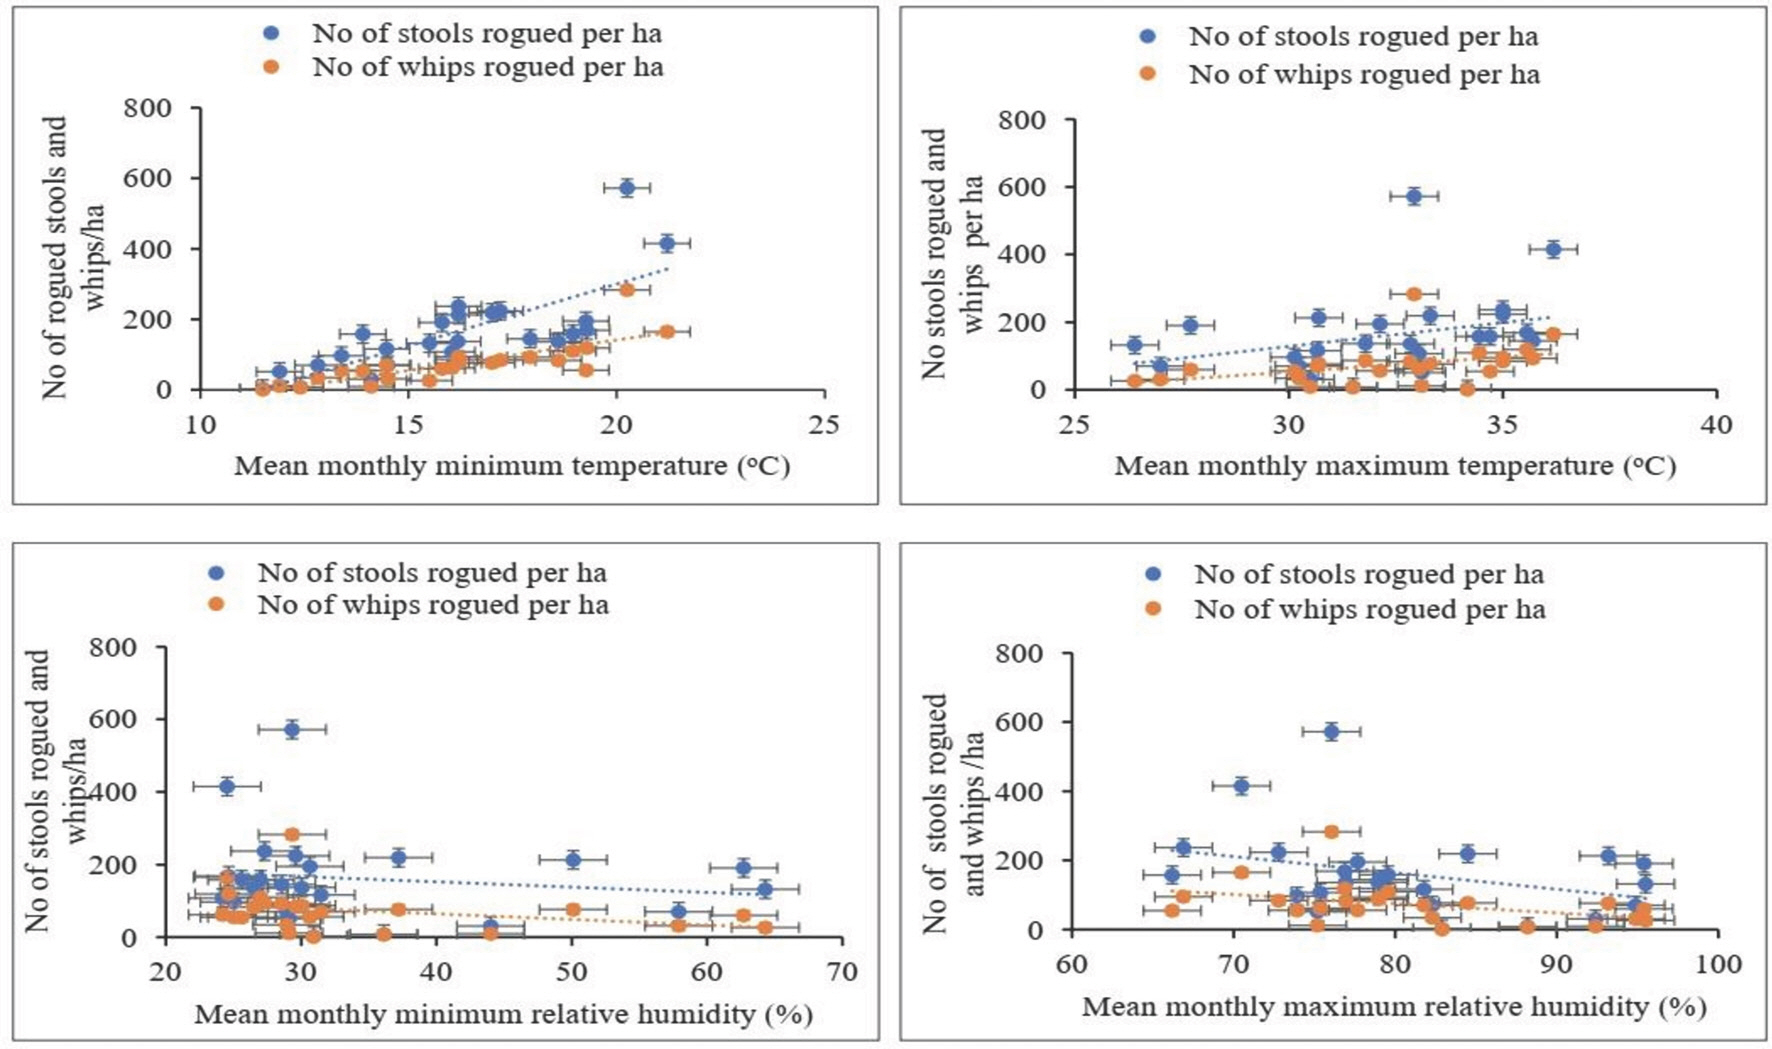
The findings clearly marked that, among the weather variables considered, mean minimum temperature (when progressively increasing) appeared to be the most important factor contributing to the development of smut disease. In another study, Neelam et al. (2012) elaborated that minimum temperature was the most influential factor, which contributed about 77% to 87% of the variations in infection with the sugarcane smut pathogen. Marchelo-d'Ragga and Ahmed (2015) also noted the epidemiological significance of weather variables, especially temperature, in sugarcane smut disease development.
The multiple linear regression equations involving weather factors as predictor variables and numbers of smut-affected stools and whips as response variables were developed based on smut monitoring and rogueing data collected from Fincha and Metehara sugarcane plantations (Table 5). The results revealed that mean monthly minimum and maximum temperatures, relative humidity, and mean monthly total rainfall were the major factors affecting disease development at different magnitudes of importance (Table 4). The multiple regression models developed for the numbers of smut-affected stools and whips are demonstrated in the following equations: numbers of smut-affected stools (y) = 347.75 + 23.39x1 - 0.44x2 - 0.54x3 - 7.44x4 + 0.72x5; numbers of whips (y) = 81.92 + 14.37x1 - 2.78x2 - 2.05x3 - 1.18x4 + 0.21x5.
Table 5.
Multiple linear regression models for weather parameters on mean numbers of smut-affected stools and whips rogued in Fincha and Metehara sugarcane plantation, Ethiopia, during 2015 to 2021 cropping years
The multiple linear regression equations indicated that most of the weather variables established negative associations with number of smut-affected stools and whips, except mean monthly minimum temperature and mean monthly total rainfall. The mean monthly minimum temperature showed a significantly positive relationship with the numbers of smut-affected stools and whips. In addition, mean monthly maximum temperature also had a significant contribution to the whip emergence. Just the reverse, the mean monthly minimum and maximum relative humidity had negative associations with both response variables. In the regression analysis, about 68.48% and 66.58% of the variations in the numbers of smut-affected stools and whips, respectively, were due to the mean monthly minimum and maximum temperature, relative humidity, and mean monthly total rainfall (Table 5). The values of R2 in the model were significant at 5% level of confidence.
In line with this study, Mehira and Sahu (2015) reported a significantly positive association (r=0.074) between smut and temperature, but a negatively significant (r=-0.683) association between smut and relative humidity. The authors observed a non-significant association between smut and rainfall, wind velocity and sunshine. The negative associations could be due to the specific weather conditions that the smut pathogen requires for spreading, germination, infection, and disease development. Magarey et al. (2011) also reported the occurrence of the most severe smut in hot, dry, irrigated farming systems. The authors demonstrated slower spread and escalation under high rainfall conditions, resulting in lower disease pressures.
Variability of smut intensity across successive crop types of the sugarcane varieties with three reaction categories (resistant, intermediate and susceptible)
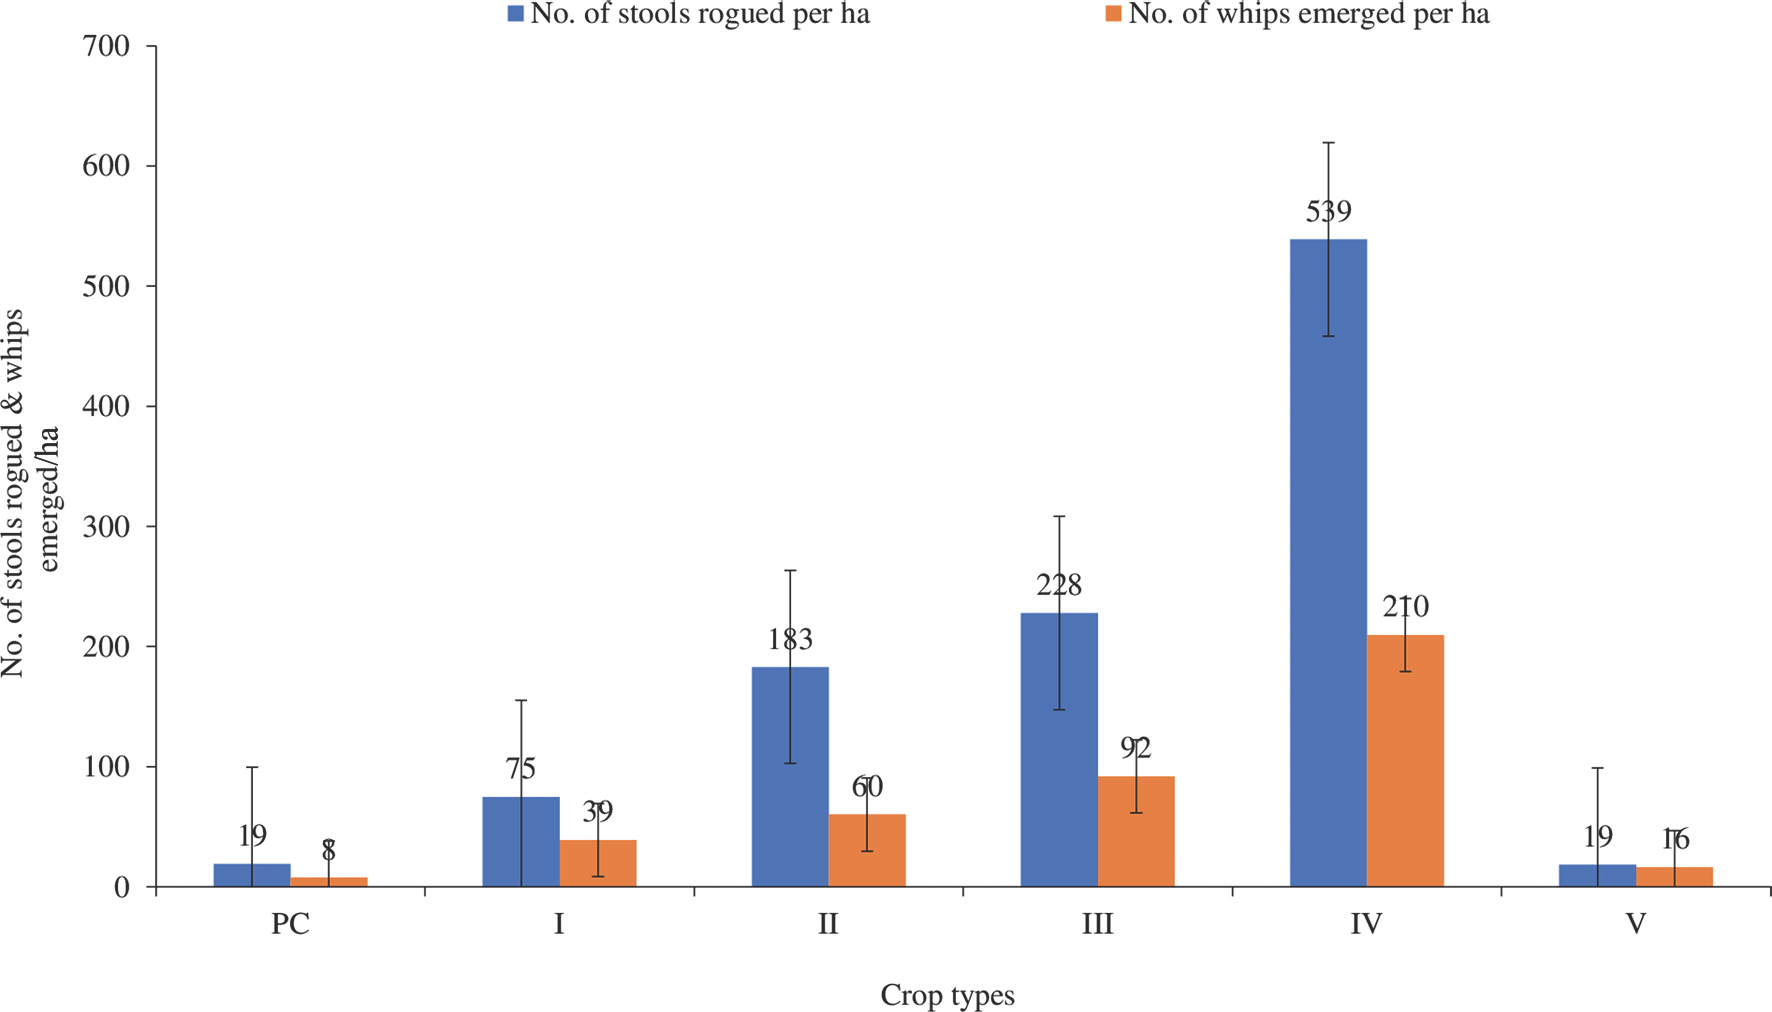
1. Fincha. Smut intensity expressed in terms of the numbers of smut-affected stools rogued and whips that emerged per hectare on three commercial varieties (resistant [B52 298], intermediate [D42/58], and susceptible [NCo 334] reaction classes) across successive crop types at Fincha sugarcane plantation is summarized in Figs. 4-6. Observations witnessed that none of the B52 298 variety plants was affected by smut in the plant cane crop type (Fig. 4). On the other hand, B52298 plants in the first ratoon scored the highest mean numbers (83) of rogued smutted stools per ha, while the maximum number of whips per hectare of 18 were emerged in the second ratoon (Fig. 4). Moreover, the maximum numbers of smut-affected stools rogued (51) and whips that emerged (13), in the case of the variety D42/58, increased as cycles proceeded from plant cane to second ratoon; and reached the maximum values of each parameter in the second ratoon crop type. However, the numbers of smut-affected stools and whips progressively declined after the second ratoon crop type (Fig. 5). Unlike the other two varieties studied, the NCo 334 variety showed continuous increase in the numbers of smut-affected stools and whips emerged as crop types proceed from plant cane to fourth ratoon (Fig. 6). The fourth ratoon crop type of NCo 334 variety displayed the highest numbers of smut-affected stools (539) and whips (210), while the lowest number of stools (19) and whips (8) appeared in the plant cane crop type.
Fig. 4.
Mean numbers of smut-affected stools rogued and whips that emerged per ha across the six crop types (plant cane [PC], I-V [ratoon 1 to 5]) planted with B52 298 at Fincha.

Fig. 5.
Mean numbers of smut-affected stools rogued and whips that emerged per ha across the six crop types (plant cane [PC], I-V [ratoon 1 to 5]) planted with D42/58 at Fincha.
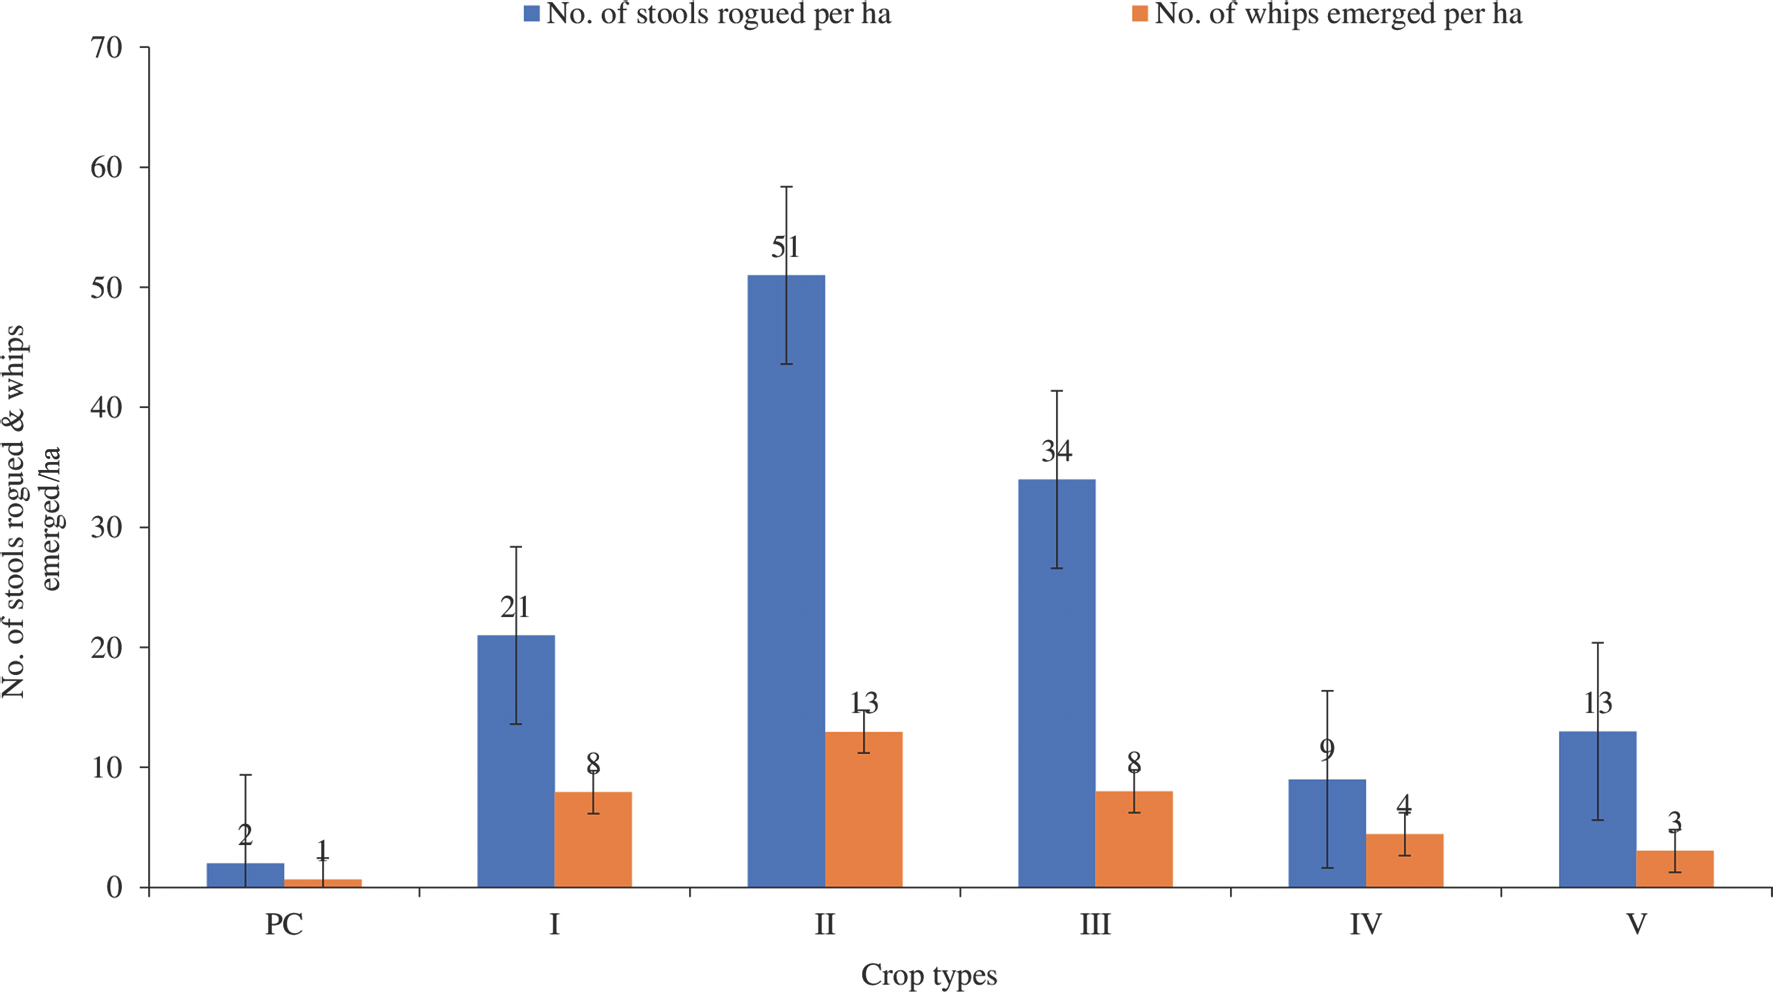
Fig. 6.
Mean numbers of smut-affected stools rogued and whips that emerged per ha across the six crop types (plant cane [PC], I-V [ratoon 1 to 5]) planted with NCo 334 at Fincha.
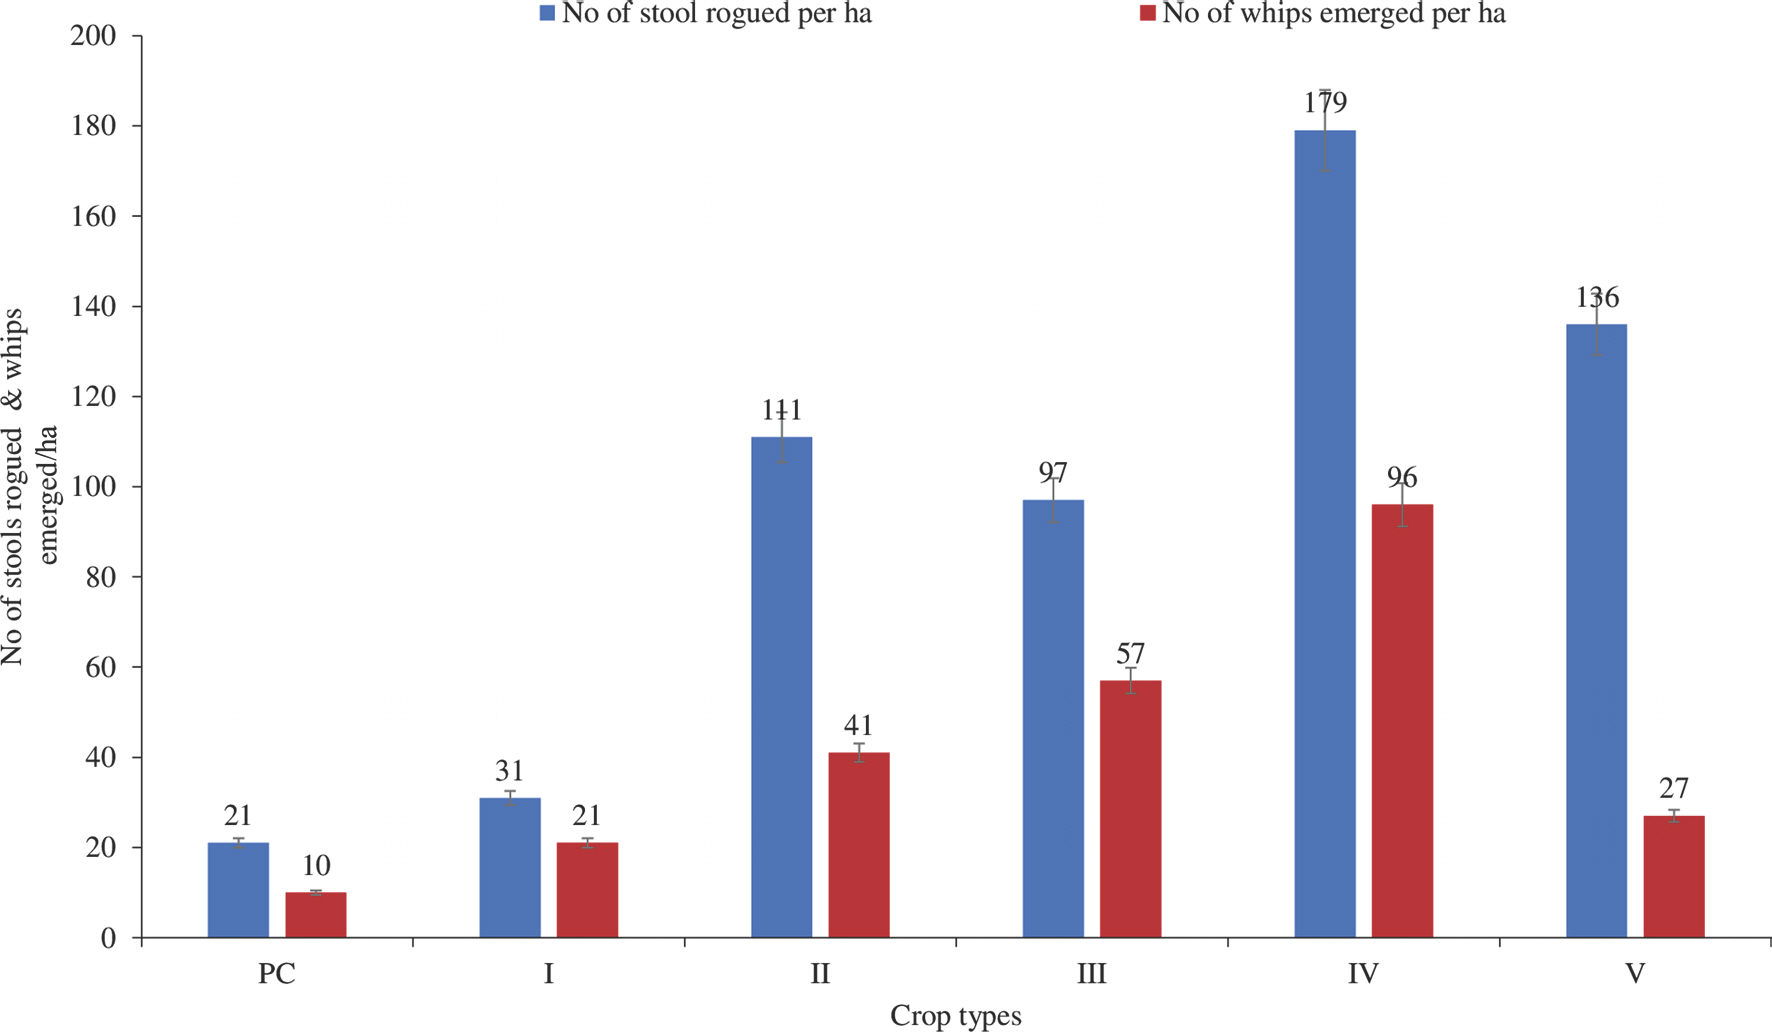
2. Metehara. Unlike Fincha, the mean number of smut-affected stools and whips that emerged per ha showed a different trend on the B52 298 variety at Metehara (Fig. 7). At Fincha, the number of rogued stools and whips reached maximum at the first ratoon, then abruptly declined afterward, but at Metehara, the number of rogued stools and whips increased as it went from plant cane to the fourth ratoon, and reached maximum at the fourth ratoon, then declined. The mean numbers of smut-affected stools rogued and whips that emerged per ha for the B52 298 variety were observed to increase up to the fourth ratoon, then declined afterward at Metehara. The maximum mean numbers of smut-affected stools and whips recorded at the fourth ratoon were 54 and 33, while the minimum mean numbers of smut-affected stools and whips at plant cane were only 3 and 1, respectively (Fig. 7). In the variety Mex 54/245, there were greater mean numbers of smut-affected stools and whips than in the variety B52 298 (Fig. 8). The assessment indicated that the numbers of smut-affected stools and whips showed different trends across the crop cycles, contrary to what was observed for variety B52 298 (Figs. 7, 8). With regard to Mex 54/245, the numbers of smut-affected stools and whips increased in the first three crop types and then declined up to the fifth crop type (Fig. 8). The mean numbers of smut-affected stools and whips ranged between 5 and 162, and 2 and 91 in that order. The lowest number of stools and whips were recorded on plant cane, while the highest number of stools and whips were recorded for the third crop type (Fig. 8). However, the mean numbers of smut-affected stools and whips on variety NCo 334 showed different trends with Mex 54/245 variety (Fig. 9). On NCo 334, an increase in the numbers of smut-affected stools and whips was observed up to the second crop type, then decreased at the third crop type, resumed to increase at the fourth, and once again decreased at the fifth, which was a serpentine type of trend (Fig. 9).
Fig. 7.
Mean numbers of smut-affected stools rogued and whips that emerged per ha across the six crop types (plant cane [PC], I-V [ratoon 1 to 5]) planted with B52 298 at Metehara.
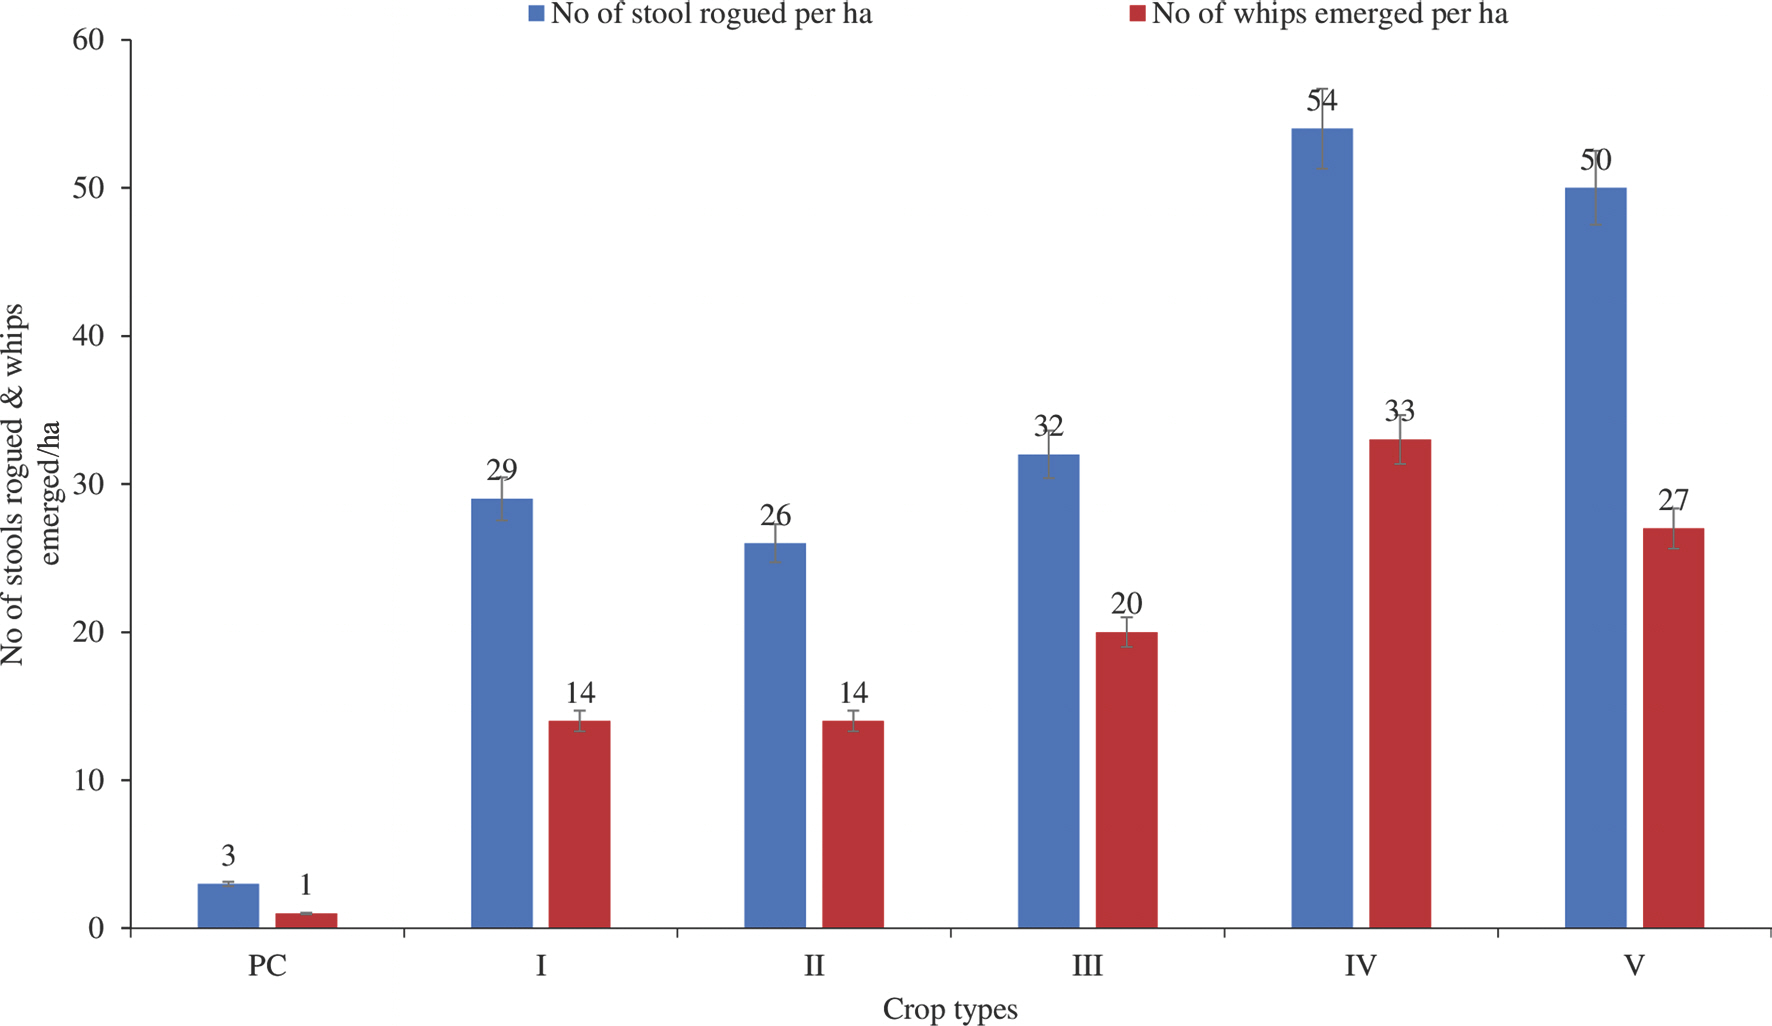
Fig. 8.
Mean numbers of smut-affected stools rogued and whips that emerged per ha across the six crop types (plant cane [PC], I-V [ratoon 1 to 5]) planted with Mex 54/245 at Metehara.
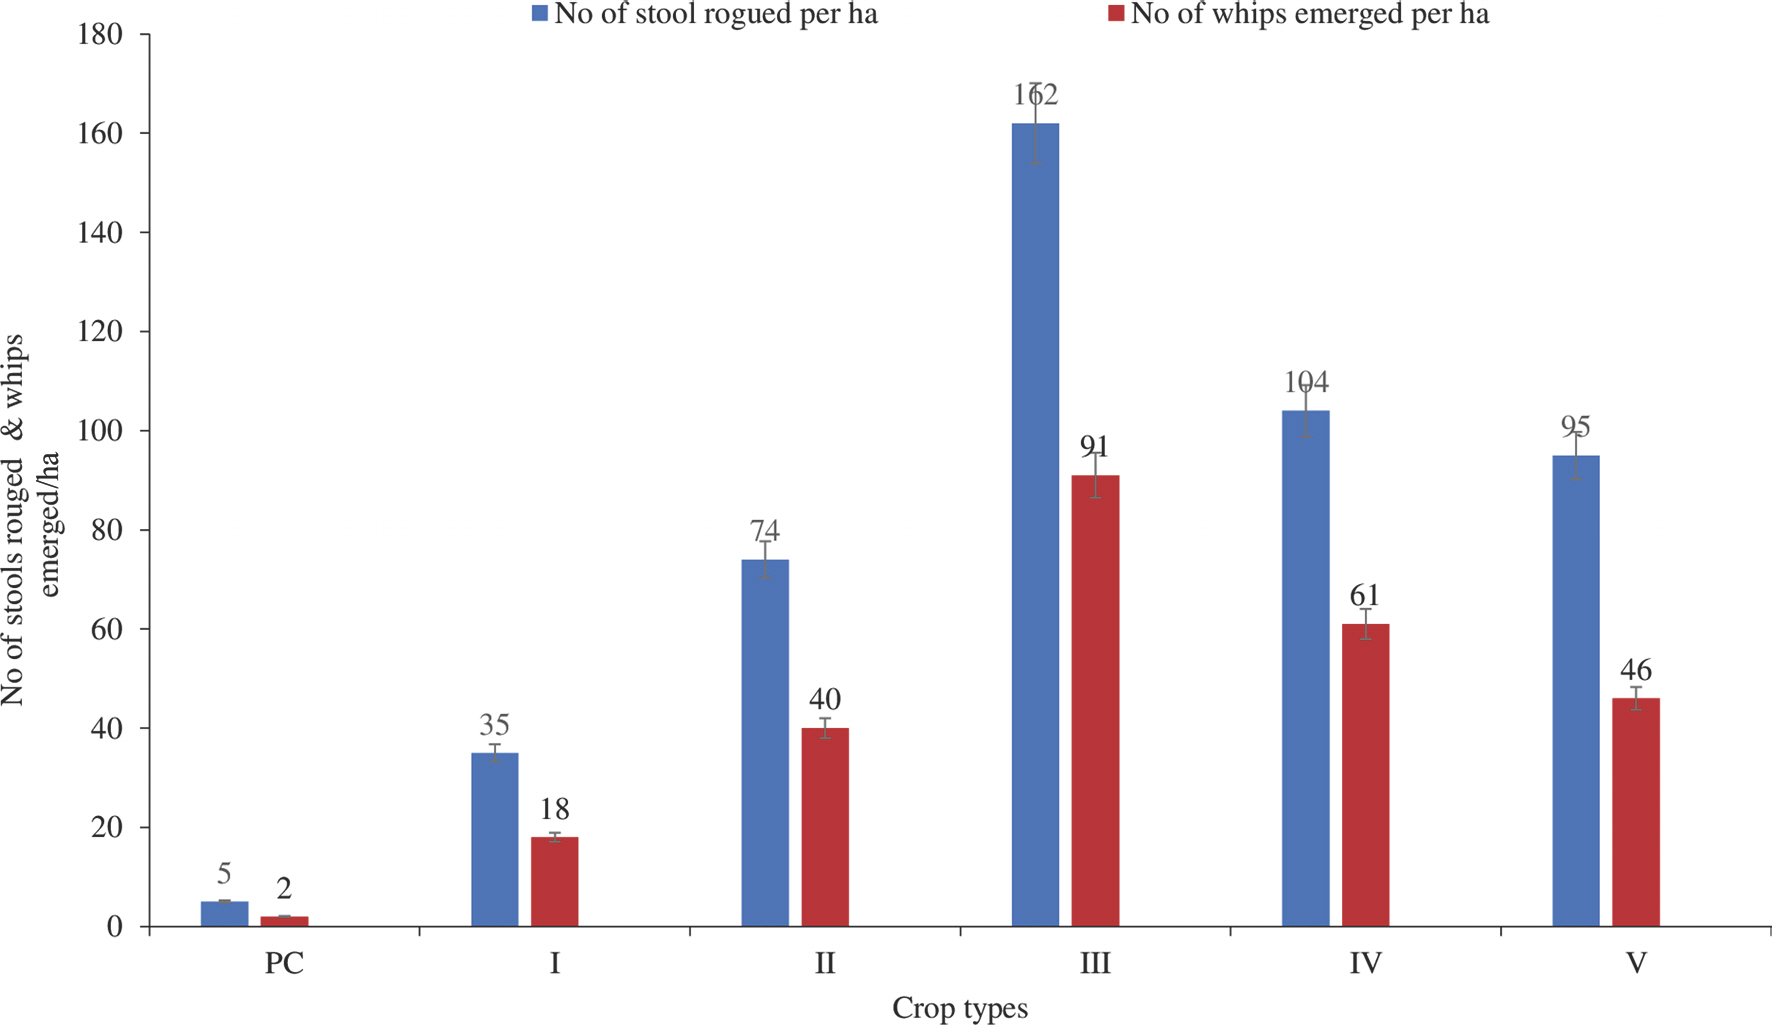
Fig. 9.
Mean numbers of smut-affected stools rogued and whips that emerged per ha across the six crop types (plant cane [PC], I-V [ratoon 1 to 5]) planted with NCo 334 at Metehara.
The findings of the study confirmed the presence of variability in rates of smut development among the three commercial varieties across successive crop types at Fincha. The variations could be explained by the differences in genetic background, morphological and biochemical constituents of the test varieties that might influence infection and the development of smut pathogen or disease. Previous studies also reported similar trends in the reactions of sugarcane varieties to smut pathogens (Mohammed, 2016; Song et al., 2019). In the current study, greater numbers of smut-affected stools and whips appeared in ratoons than in plant cane in all three varieties, though the pressure fluctuates among successive ratoons of each variety, which could apparently be associated with the presence of smut inocula year after year. Likewise, Bhuiyan et al. (2010) noticed that there was a significant varietal interaction between ratooning and smut incidence, with incidence increasing in older ratoons in some varieties and stabilizing or even decreasing in others. Marchelo et al. (2008) and Tom et al. (2017) justified it as the buildup of smut in successive ratoons, especially in susceptible varieties, is responsible for a high degree of smut infection and development in ratoons. Earlier, Whittle and Walker (1982) described sugarcane smut as a more complex disease with a variety of symptoms, latent periods of infection inside the plant, an uncertain environmental component and, since it is a perennial crop, possibilities of different host-parasite relationships over months or years or crop types. This demonstrated that there could be variation in varieties’ reactions to smut over months, years, and crop types.
Sugarcane smut is identified as the priority disease which caused a significant reduction on the above-ground growth of sugarcane on Ethiopian sugarcane plantations. The study showed a reduction in numbers of tillers, plant height, stalk thickness, number of leaves, and leaf area index, which ranged from 18.39% to 73.42% at the two locations, though higher percent reductions due to smut were observed at Fincha than Metehara. High reduction in the above-ground growth of sugarcane plants implied the need to develop sustainable management strategies so as to reduce the impact of the disease on cane and sugar yield. It can also be concluded that the intensity of sugarcane smut is highly influenced by weather factors, varieties and crop types. The knowledge of weather factors that favored the development of smut, help decision makers to select variety, management options, and ratooning decision. In the correlation analysis, weather factors such as mean monthly minimum temperature, maximum temperature, minimum relative humidity, maximum relative humidity, and rainfall were identified to affect smut disease epidemics at different levels. However, the mean minimum temperature was found to be the most important parameter contributing to the development of smut disease through optimizing teliospore germination and infection, as revealed by the multiple regression model. In this model, the variation in 68.48% of smut-affected stools and 66.58% of whips emerged was explained by weather variables, such as mean monthly minimum and maximum temperatures, relative humidity, and mean monthly total rainfall. Long-year observations also confirmed that ratoon crops had more smut intensity than the plant cane across locations, irrespective of the fluctuations in smut intensity among successive ratoon crops. Thus, the study concluded that sugarcane smut greatly reduced the above-ground growth of the crop, with a direct effect on cane and sugar yield. The above generated information on the level of reduction of sugarcane smut on the above ground growth, association of smut with weather, varieties, and crop types is important in management decisions, resource allocation for research and prioritizing research theme. Furthermore, this study suggested future research which should focus on developing efficient decision-support systems for smut disease forecast based on regular disease monitoring, thus will result in the development of precise forewarning systems of a possible outbreak of the disease.
 PDF Links
 PubReader
 ePub Link
 Full text via DOI
 Download Citation
 Print
Print